About the Porta Dashboard

A summary of data related to authentication and authorization activities in your applications.
The Porta Dashboard page provides a summary of key data about the authentication or authorization activities in your applications. It includes information on active users, registrations, active users by country, and activity using social logins. Data on authentication activities is presented in the form of graphs and map overviews with possibilities to select custom date ranges.
Metrics - Active Users

Metrics about active users
An administrator can view the number of unique active users with successful authentication-related or authorization activity as an overview of their active user base.
Authentication activity includes but is not limited to:
Failed Logins, Successful Logins, Password Changes, Email Confirmations, Enable MFA Method(s), Disable MFA Method(s), Delete or Download Personal Data
The scorecard also displays the percentage change in the number of active users compared to the previous period. Using the date filter in the dashboard allows one to view the number of active users for previous periods and view the trend in the number of active users.
The number of active users can also be filtered by the user’s geolocation. On hover of a country, the map displays the number of active users for that country depending on the date range selection along with the percentage change from the previous period.
Registered Users

Metrics about the registered users
At the top of the page, you’ll see the total number of registered users. By default, the scorecard presents the total number of registered users regardless of the date selected. The metric is typically used to examine the progress of user growth from period to period and to understand how much strategic initiatives are driving the registration rate.
Things to know:
Any successful registration where a user registers and verifies their registration is counted toward the total number of registered users
Registrations using social providers are counted toward the total number of registered users
Logins by Identity Provider
An administrator can view the number of unique daily users with successful authentication activity filtered by Identity Provider.

An overview of logins via Identity Providers
Things to know:
Logins are limited only to authentication activities and represent successful authentications only (not to be confused with Active Users which includes other authentication-related and authorization activities)
The overview displays a list with the number and percentage of active users depending on their social provider depending on which providers have been configured for your applications. Please note that the list displays even providers that have not been configured with metrics defaulting to zero.
Data by Date
Selecting specific data by date
Things to know:
Roles: Viewing the Porta Dashboard is at this time not restricted to the user having a specific role.
Default Metrics: By default, all metrics display data on the last 30 days. All percentage comparisons are between the previous 30 days.
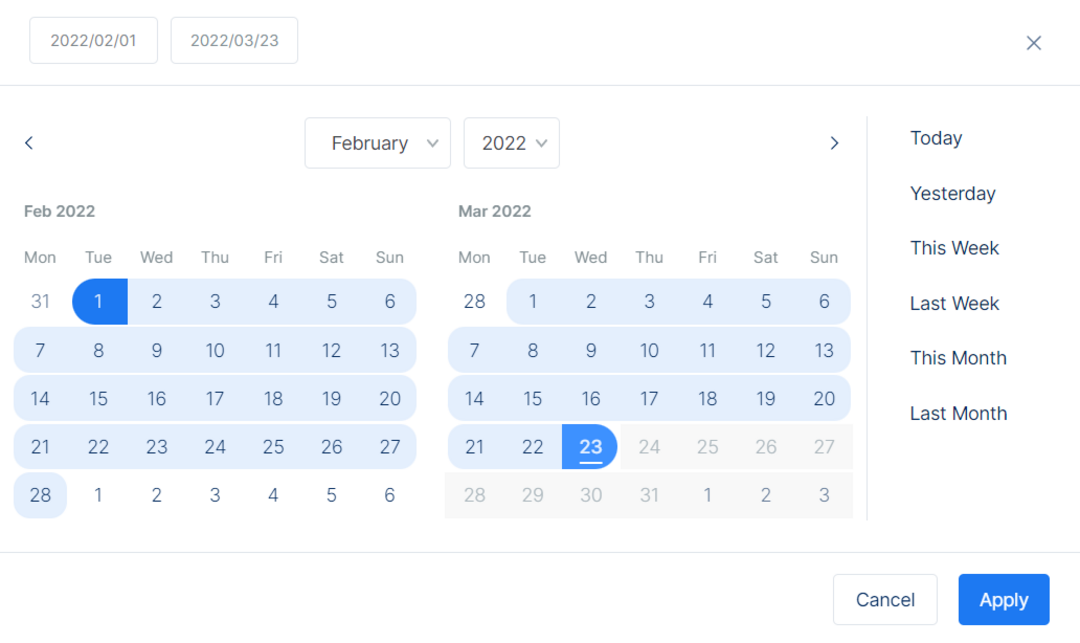
Custom Date range selection (Start Date - End Date): Only a date prior to the current date can be selected as the end date when using a custom date range. This is done to ensure data accuracy and consistency.
Single Date selection: When the admin selects only one day to filter, Porta displays metrics for only that particular day. All percentage comparisons are between the chosen date and the day before that date
Map Overview

An overview of the Active Users by Country